Day One Pre-workshop Assignment
Overview
Teaching: 0 min
Exercises: 30 minQuestions
What is biotic interaction data?
Why/How do researchers publish interaction data?
Why/How do researchers reuse existing interaction data?
Objectives
Explore ways to find existing interaction datasets
Understand common definitions of biotic interaction data
Provide one example of an existing publication that includes interaction data
Articulate benefits of openly sharing research data
Getting Started
Welcome to the pre-workshop assignment page of the Dead Wood 2021 Interaction Data workshop!
In this workshop, we’ll be discussing topics related to species interactions (aka biotic interactions or biotic associations) through talks, hands-on assignments, and group discussions.
Our work will be documented in interactive, collaborative documents like:
https://docs.google.com/document/d/1UaBocn4xURgGeLqsRXmzCXkRY59Ua_2vZdLryRKZ_9I/
Assignment: Introduce Yourself
- Go to https://docs.google.com/document/d/1UaBocn4xURgGeLqsRXmzCXkRY59Ua_2vZdLryRKZ_9I/,
- Add your name,
- Add your field of work/study/research, and
- Describe a species interaction you enjoy or find interesting.
If you’d like, you can copy and paste the following example:
Hi, my name is [name]. The pronouns I use are [pronouns]. I am interested in [field of study/research/work]. In this workshop, I’d like to [goals]. One of my favorite biotic interaction is that of a [describe a species interaction].
To help you get started, I filled out mine:
Hi, my name is Jorrit. The pronouns I use are he, him, his. I am interested in biodiversity informatics, open science, and software engineering. In this workshop, I’d like to better understand how to make it easier for students/researchers to share and reuse species interaction data. One of my favorite interactions is of this bird (Sula leucogaster) riding on the back of a sea turtle (Chelonia mydas). See https://www.inaturalist.org/observations/10161815 .
What are Species Interactions?
Species interactions drive the ecological engines that keep us alive. Bluntly said: without pollinators, crops would fail, without predators, populations would grow unchecked. Also recent events suggest that better understanding specific species interactions (e.g., virus-host interactions like bat zoonoses) may help us better predict, manage, or even prevent future pandemics.
Assignment: Define "Species Interaction"
Write a short description of what you consider a good definition of a species interaction (with references if available).
Share your results in the collaborative document with your name as a prefix in the “Species Interaction Definitions” section.
Make sure that your definition is different than those already added.
How are Species Interactions Datasets Made Available?
Species interactions are an important aspect of the functioning of ecosystem. To study these ecoystems we need records, or datasets, of known species interactions. However, you may find that species interaction datasets are hard to find and access.
Assignment: Find Published Interaction DatasetMany researchers openly publish their species interaction data in peer-reviewed journals. > 1. Find an example of such a published dataset and describe how you find it.
Add the reference to the dataset and how you found it to the collaborative document, prefixed by your name.
Make sure that your example is different than those already added.
Why share?
Some researchers have good reasons for either sharing or not sharing their valuable species interaction data.
Assignment: Why share?
Articulate one (or more) reason to share species interaction data, and,
Articulate one (or more) reason to not share, species interaction data.
Share your reasons in the collaborative document, prefixed with your name.
Make sure that your reasons are different than already existing ones.
Next Up: Workshop Day One
To continue your preparation for the workshop, please consider reading the following research publication:
Background ArticlesHortal, J. et al., 2015. Seven Shortfalls that Beset Large-Scale Knowledge of Biodiversity. Annual Review of Ecology, Evolution, and Systematics, 46(1). Available at: https://doi.org/10.1146/annurev-ecolsys-112414-054400.
Piwowar, H.A., Day, R.S. & Fridsma, D.B., 2007. Sharing Detailed Research Data Is Associated with Increased Citation Rate. PLoS ONE. Available at: https://doi.org/10.1371/journal.pone.0000308.
Soranno, P.A., 2015. It’s Good to Share: Why Environmental Scientists’ Ethics Are Out of Date, BioScience. Available at https://doi.org/10.1093/biosci/biu169.
Tedersoo, L., Küngas, R., Oras, E. et al. . 2021. Data sharing practices and data availability upon request differ across scientific disciplines. Scientific Data. Available at: https://doi.org/10.1038/s41597-021-00981-0.
If you have troubles accessing the articles, please contact the workshop organizers.
Key Points
Availability of species interaction datasets is limited
Open Data, Open Science, and FAIR principles facilitate data availability
Day One Group Assignment Part One
Overview
Teaching: 0 min
Exercises: 105 minQuestions
How are interaction data published and shared?
How can you find interaction data?
What are skills needed to review a dataset?
What makes a dataset easy to reuse?
Objectives
Articulate how interaction datasets are shared and published
Discuss ways to structure a data review
Get a feel for what it takes to reuse a dataset
Write a data review
In the pre-workshop assignment you:
-
introduced yourself (part 1),
-
defined what a species interaction is (part 2),
-
found a published interaction dataset (part 3),
-
and articulated the positive and negative sides of openly sharing data (part 4).
In this morning group exercise,
-
we’ll first say hi and
-
share some details on your own trophic interactions this morning (i.e., your breakfast). After that,
-
we’ll have a close look at your favorite species interaction, followed by
-
an in-depth reviews of some of the interaction data publications you’ve selected.
Please try and stick to the provided timelinesThe short timelines are meant to simulate the immense time pressure that some academics are under.
But also, in academic tradition, please feel free to ignore instructions, and improvise when appropriate.
Introductions
Exercise 1. Say HiTotal time ~ 10 minutes (10:15-10:25 CET)
Take a moment to look around your meeting space (virtual or not), and wave at your fellow participants. Turn on your video so that others can do the same. Notice the different names, faces, and locations.
Then:
open the collaborative meeting notes at https://docs.google.com/document/d/17CYNNt0YA5QOQwdXCPsVjJgcsPJ5834ycnmMIoM0b5A
add your name, preferred pronouns, and what you ate for breakfast in the document (< 30 seconds)
after everyone entered their name, take turns giving a short 30 second introduction by voice/video (< 30s * 16 ~ 10 minutes)
after you introduce yourself put a +1 sign after your name
Now that we know a little more about each other, and heard each others voice, please realize that you all come from different backgrounds and bring unique skills and experience to this workshop.
Please be patient with yourself and others when interacting with others, and encourage yourself and others to speak up, listen, and collaborate.
Dissecting Species Interactions
Species interactions are diverse and complex, and may be tricky to classify, parse, and organize.
Exercise 2. Parsing Species Interactionstotal time ~ 35 minutes (10:25-11:00 CET)
In the pre-workshop assignment, you shared an example of a species interactions.
Now, we are going to closely examine these examples:
open the collaborative meeting notes at https://docs.google.com/document/d/17CYNNt0YA5QOQwdXCPsVjJgcsPJ5834ycnmMIoM0b5A
copy your example into the notes below “Parsing Species Interactions” (< 30 seconds)
parse/identify the specific parts of your species interaction example (e.g., subject, object, kind of interaction, location), and add a row in our collaborative dataset of interaction data examples at https://docs.google.com/spreadsheets/d/1cOG1ngS0r7DHRpTTShcQIaYwdrPikg4SIJmzTXSQehY/edit#gid=0 .
⚠️make sure to use only elements from the original/verbatim text you provided in the pre-workshop assignment.⚠️
Please see https://github.com/globalbioticinteractions/template-dataset#data-format-and-dictionary if you need some inspiration for terms.
Now, you’ve gotten a sense of what it takes to transcribe species interaction claims from text, let’s discuss some questions related to the kind of information you extracted.
Discussion: What makes for a useful species interaction description?Take some time as a group to comment on the following questions in our collaborative meeting notes:
Which verbatim descriptions of species interactions do you find informative?
What information elements help describe species interaction records?
What format to describe species interaction records do you find useful?
Congratulations, you’ve just collaboratively transcribed and discussed examples of species interaction records!
Time permitting, please take a break to celebrate.
Reviewing Existing Species Interaction Datasets
So far, we’ve looked at descriptions of individual records. Next, we’ll have a look at published collections of species interaction records, or existing species interaction datasets.
But first, we’ll come up with a list of datasets we’d like to review.
Exercise 3. Curate a list of species interaction datasets for reviewTotal time ~ 10 minutes (11:10 - 11:20 CET)
Copy-paste your citation (max 1 per participant) of a published interaction dataset from the pre-workshop assignment 1 into our collaborative meeting notes in the
Selecting Existing Species Interaction Data For Reviewsection, prefixed with you name in parenthesis.Wait until everyone is finished (< 1 minute)
Starting from the top, each participant explains why they selected the study and what kind of interaction data it contains (< 30s per citation)
After each citation has been discussed, place a +1 next to the citation that you are interested in. You can use only 1 “+1” per citation. (< 30s)
After the votes are in, select the three most popular citations. Mark the citations in bold in the collaborative document.
Take a minute or two to confirm that the 3 selected works in fact contain a species interaction dataset. If not, replace the dataset-less study with another from the big list.
We’ve now narrowed down our list of data publications to three, and we are getting ready to review them.
Reviewing Species Interaction Datasets
Data review is an important phase in the scientific publication process.
In this section, we’ll take the three selected publications and review them separately in groups.
To help expedite the process, we’ll split the participants into groups of 3-4.
Each group will review all selected publications using the Nature Scientific Data’s “Guide To Referees”, section “Writing the Review” (see https://www.nature.com/sdata/policies/for-referees#writing-review).
Finally, each group will assign a “reject”, “accept with minor revision”, “accept with major revision”, or “accept” to each publication.
Exercise 4. Write a data reviewTotal time ~ 40 minutes (11:20 - 12:00 CET)
To start with the review, go to the “Say Hi” section of our collaborative notes at https://docs.google.com/document/d/17CYNNt0YA5QOQwdXCPsVjJgcsPJ5834ycnmMIoM0b5A/edit#heading=h.8onc5phlhi9u .
Randomly divide the participants in groups of 3-4 participants
For each group, create a break-out room, and select one of the pre-created group review documents, and add participants names.
For each group, copy-paste the citations, review instructions.
For each group, discuss among participants how to complete a review for all selected publications, using the review instructions as guideli
Each group starts reviewing the selected publications independently.
If you feel ambitious, you can use some of your 12:00-14:30 break to continue collaborating on your group reviews.
At 14:30, each group will have 5 minutes to share their recommendations for the selected publications.
(extra credit) consolidate the reviews into a single consensus recommendation for each publication.
What’s Next?
See workshop page for what is next!
Key Points
Many species interaction datasets are openly published
Interaction data are shared in various ways
Many interaction data records have common data elements
Reviewing data can be time consuming
Day One Group Assignment Part Two
Overview
Teaching: 20 min
Exercises: 55 minQuestions
How to find any kind of species interaction dataset?
How to make it easier to review of interaction datasets?
How facilitate interaction data access?
Objectives
Articulate challenges of sharing, reviewing, and reuse interaction datasets
Discover alternate ways to share, review, and reuse interaction data
Earlier, we’ve had a close look at individual interaction descriptions. Also, we collaborated to review existing species interaction datasets.
Now, we’ll look into ways to help facilitate ways to share, find, and analyze, species interaction datasets.
The main focus of these exercises is https://globalbioticinteractions.org , but note that other projects like Mangal, Web of Life, Interaction Web Database Data also aim to make species interaction data easier to find and reuse.
In the 75 minutes afternoon session, we’ll quickly go over some available workshop sections.
Then, rather than trying to do all of them in this afternoon, we can vote on which one to do first, then time permitting we can repeat the exercise for the remaining parts.
If you’d like, the sections will be available after the workshop for independent work.
The following sections are available (slightly adapted from a previous workshop by Katja Seltmann and Jorrit Poelen in context of the https://parasitetracker.org project.
- Getting Interaction Data (~10 mins)
- Exploring Species Interaction Records By Pointing and Clicking (~30 mins)
- Working with the Whole (GloBI) Dataset (~30 mins)
- Working with Data Sources (~20 mins)
- Taxonomic Name Review (~20 mins)
- Interaction Data Record Review (~20 mins)
Exercise 1. Vote on our afternoon scheduleLet’s vote and what we’d like to do as a group in the rest of the afternoon.
Go to the collaborative meeting notes section
selecting afternoon scheduleVote by adding +1’s to the items you’d like to do as a group
We’ll do as many episodes as we can until 16:30
We’ll continue to take notes collaboratively, to ask questions, share insights.
Please feel free to revisit the episodes we covered, and ask engage in discussion with fellow participants or meeting organizers.
Also, episodes that we did not get to will be available for your to explore.
What’s Next?
Please see schedule for our next collaborative activity.
Key Points
Automated taxonomic name linking facilitates discovery, review, and interpretation, of interaction records
Keeping track of data provenance/origins can be tricky
Specialized search indexes like GloBI can help facilitate data discovery
Automated linking and index processes are likely imperfect and subjective
Getting Interaction Data
Overview
Teaching: 5 min
Exercises: 5 minQuestions
Where can I download interaction data?
What formats are the data available?
Objectives
Understand the available ways to get interaction data
Understand the columns of the downloaded data
Getting oriented with GloBI interaction data
Let’s get oriented with the interaction data found on GloBI. GloBI data products are interpreted in order to bring together disparate data sources (literature, observations, collections, etc.). This means that GloBI data products are opinionated and may be incomplete compared to the original data sources. Original data can be found from the citations and these should still be considered the detailed building blocks for the entire interaction dataset.
Some of the different sources of data include natural history collection records, observations extracted from the literature, interaction and network datasets, observations from community science programs and other, larger aggregated datasets.

Where to find data
Navigate to the GloBI Data Products page and explore the Original Data Sources.
What is what?

stable versions of the data are versioned in the doi:10.5281/zenodo.3950589 GloBI data publication. A new version is done about every six months.
snapshot are the most recent, live data. Thus, this could change daily! Great for exploration and preliminary analysis.
How many records are in the GloBI dataset. It is a lot!
wc -l interactions.csv
Data publication
For research or other data intensive project, it is suggested to use GloBI’s stable versioned integrated data published via doi:10.5281/zenodo.3950589 or create a new data publication that contains the data you are using.
Other ways of accessing GloBI data
Exploratory, interactive queries can be executed through SPARQL and Cypher endpoints, GloBI Search/Browse pages, or by using the REST-y GloBI Web API. For those that use R, rglobi is available to explore interaction data. rglobi can also be used to execute Cypher queries. However, it is best to consider these as methods for exploring data rather than data access points. If you are doing research, download the full dataset and create a version of it.
Discussion: Why is it important to version the GloBI data in research?Take a moment to discuss as a group why it is important to version, publish, or archive a copy of the GloBI dataset you use for research. What are some ways to archive datasets?
Key Points
GloBI has interaction data that can be accessed as a full dataset
Better to use the full or whole dataset than the APIs
Working with the Whole Dataset
Overview
Teaching: 20 min
Exercises: 10 minQuestions
How can I get started with the whole interaction dataset?
Is this the only way to manage the interaction dataset?
Objectives
Trim the dataset to only records that contain Ixodes
Put dataset into R and poke around
Add dataset to sqlite database
Learn from each other and ask questions!
Goals
The entire or whole interaction dataset on GloBI consists of over 6 million interaction records. There are many ways to approach a large dataset and this exercise is to demonstrate one example using shell and R. We are not going to follow along with shell and introduction to R tutorials in this workshop, but Carpentries has a few nice ones to get you started, including Introduction to shell and Introduction to R.
These exercises can be followed along using R and shell, but it is not necessary. If you would like to follow along, please go ahead and open R-studio and your shell window.
Getting started
At the end of this time we will regroup and report back the other workshop participants about what we did in this breakout group. Who would like to be the person/s who report back for the breakout group?
Let’s collaboratively take notes in the Google Document. The link to the document is in the chat.
Find all of the records in the dataset based on a taxon name
We are interested in finding all of the records in the interactions.csv dataset that deal with Ixodes and we are interested in reducing the size of the data so it is easier to manage. One quick way to do this is via the shell.
How many records are in the GloBI dataset. It is a lot!
wc -l interactions.csv
One of the first things we might want to do is trim the dataset to only those taxa we are interested in analysing. In this case, we will look for all Ixodes records. To do so, we will use a simple shell script, extract all of the rows that contain the word Ixodes and create a new file file. This process will help reduce the size of the dataset so we can use R for our analysis. The shell script will take ~ 4 minutes and 12 seconds to complete!
sh Globi_Ixodes_data.sh
When we examine the code in the script we see that it is using grep, which is “a Unix command used to search files for the occurrence of a string of characters that matches a specified pattern”. Grep matches on the row and does not specify which column Ixodes is found. We then sort the records to look for only exact, unique versions of the records.
echo Creating headers
head -1 ../data/interactions.csv > ../data/Ixodes_data.csv

echo Finding all Ixodes
cat ../data/interactions.csv | grep -w "Ixodes" >> ../data/Ixodes_data.csv
wc -l ../data/Ixodes_data.csv

echo Sorting unique records
sort -r ../data/Ixodes_data.csv | uniq > ../data/Ixodes_data_unique.csv
wc -l ../data/Ixodes_data_unique.csv
If you want to find several taxa and combine the datasets, you could create files from multiple taxa and combine the output together into a single dataset using cat. An example of this can be found here. This example takes all files of the files in the Data folder that contanin the pattern unique.tsv and creates a new file called *all_data.txt**._
cat ../Data/*unique.tsv >> ../Data/all_data.txt
Now lets compare the new datasets.How many records are in the trimmed GloBI datasets? Is there a difference between unique and not?
wc -l Ixodes_data.csv

wc -l Ixodes_data_unique.csv
Let’s do something in R
Load trimmed dataset into R using R-studio. We will start by stepping through some R code and discuss the results. The R code we are using can be downloaded to follow along or you can see an html preview of the code.
We will start by just finding the columns and create a subset of the data to import into Google Sheets. Time permitting, we will talk about some of the interesting data issues we are finding in the dataset.
Exercise 1: What do the columns mean?
There are 88 columns in the interactions data file. In this exercise, we will find the columns and pick out which ones are commonly useful in research data. You can create your own list or use this Google Sheet with the first 100 rows of the Ixodes_data_unique.csv file.
- Obtain a list of all of the column names.
- How many of them deal with taxon names?
- What column/s include the citation information?
- What column/s contains the interaction information?
- What is the difference between the source and target columns?
- Describe one other important column.
Import into a sqlite database
Databases are a great way to manage large datasets and handle data filtering, sorting and grouping. Sqlite is commonly used with R as it is easily transferable with the R code. We are not going to learn sqlite today, but there are some great Carpentries tutorials to get you started, including the Introduction to sqlite. Let’s step through a few commands to see how easy it is to take a CSV file and create a sqlite database.
sqlite3 globi.db

.mode csv

.import Ixodes_data_unique.csv interactions

PRAGMA table_info(interactions);

SELECT sourceTaxonGenusName, count(sourceTaxonGenusName) FROM interactions group by sourceTaxonGenusName;

SELECT interactionTypeName, count(interactionTypeName) FROM interactions group by interactionTypeName;

.exit
Key Points
There is a lot of interaction data available and shell is one helpful tool to reduce the size of the dataset.
Sharing code helps everyone.
Exploring By Pointing and Clicking
Overview
Teaching: 15 min
Exercises: 15 minQuestions
How can I explore indexed Ixodes interaction records?
When should I use GloBI’s webtools?
How can I help point out suspicious, or missing, data?
How can I make suggestions?
Objectives
Familiarize with existing web tools
Load sample Ixodes interaction csv datafiles into a spreadsheet
Articulate limitations of Web APIs
Locate the species interaction data sources
Global Biotic Interactions offers help to explore available species interaction datasets using basic web tools. These webtools help to answer questions like: “Which organisms do Ixodes interact with?”, “Which datasets support describe Ixodes interactions?”, and “How can I suggest improvements or point out suspicious data?”
Interaction Search
The web page at https://globalbioticinteractions.org helps search for specific interactions by (taxonomic) name, interaction type (e.g., eats, parasite of, pollinates), and data source. Similar to general purpose search engines, only a subset of matching results is shown, and more can be requested if desired. The results include a description of the interacting taxa as well as the authority and data source that is said to support (or refute!) the interaction claim.
Exercise 1. Searching for interactionsUse GloBI’s interaction search page to:
- first, search for interactions that involve ticks (Ixodes)
- then, narrow to search to include only tick (Ixodes) - mammal (Mammalia) interactions
- finally, select only parasitic tick-mammal interactions
For each of the narrowing search, describe some of the data sources and references. What kind of references are they? Which data sources support the interaction claims?
Context of Interaction Results
Now that we’ve explored ways to select specific questions, let’s have a closer look at the links embedded in the search results. One of the goals of the web search tool is to provide a minimal, easy to use, way to get a sense of the wealth of interaction data that is already openly available.
Exercise 2. A closer look at interaction search results
Various icons and links appear in search results. Make screenshots of the some search result and describe what these icons and links do.
Various verbs (e.g., interacts with, parasite of) are used to categorize interactions. List a few of these verbs (aka interactions terms) and describe what you think they mean in your own words. Compare the description with the web resources the verbs link to.
Describe how you imagine your colleagues would use the species interaction search web tool. Discuss current limitations and improvement opportunities.
Point-and-click Tool 2: Interaction Browser
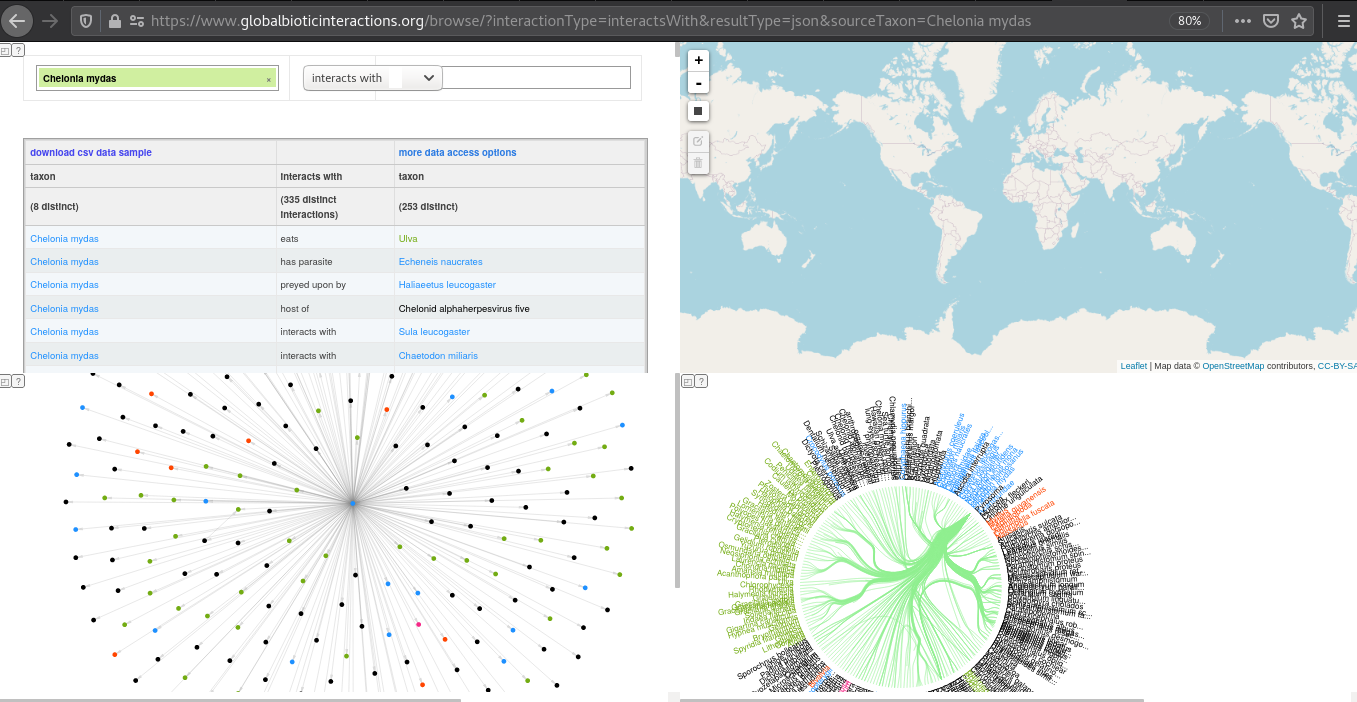
Another search tool, the interaction browser, can be found at https://globalbioticinteractions.org/browse. This tools uses network and bundle diagrams to help visualize a sample of the selected interaction data. Also, a geospatial constraints can be specified to select a specific area of interest. Finally, a sample csv file with supporting interaction data records can be downloaded for review.
Exercise 3. A more visual exploration of interaction dataFirst, open the GloBI Browser. By default, interactions of the green turtle (Chelonia mydas) are shown. It should look something like:
Now, familiarize yourself with the four panels by clicking around and exploring their interactive features:
- Can you update the search criteria to only select tick (Ixodes) - mammal (Mammalia) interactions?
- What happens when you select only North America in the geospatial selector?
- How would you share your resulting diagram with others?
Finally, click on the “download csv data sample” to download the related interactions.csv file.
Open the interactions csv file in your favorite editor and describe each of the columns in your own words. Which columns need further explanation?
(Extra Credit) Make a list of all the distinct mammalian hosts and Ixodes names that were included in the csv sample.
Key Points
Web tools are for exploring indexed data and providing feedback
Web tools facilitate communication within biodiversity data community
Web tools are dynamic and subject to change
Working with Data Sources
Overview
Teaching: 10 min
Exercises: 10 minQuestions
How does GloBI discover interaction data?
How does GloBI integrate interaction data?
Is GloBI a data repository or a search index?
Objectives
Understand where to find GloBI data sources
Understand where to find GloBI data reviews
Data Sources: GloBI’s Building Blocks
Global Biotic Interactions (https://globalbioticinteractions.org, GloBI) relies on existing species interaction datasets, or data sources. These data sources are regularly re-indexed by GloBI to include recent updates. So, rather than a data management system or repository, GloBI is more like a search engine that helps find biotic interaction data in openly available datasets.
The kinds of data sources indexed by GloBI are pretty diverse: some datasets come from professionally managed natural history collections or specialized data portals, whereas others are manually transcribe interaction records from literature, or observation records provided by citizen scientists.
A list of GloBI data sources can be found at https://globalbioticinteractions.org/sources.
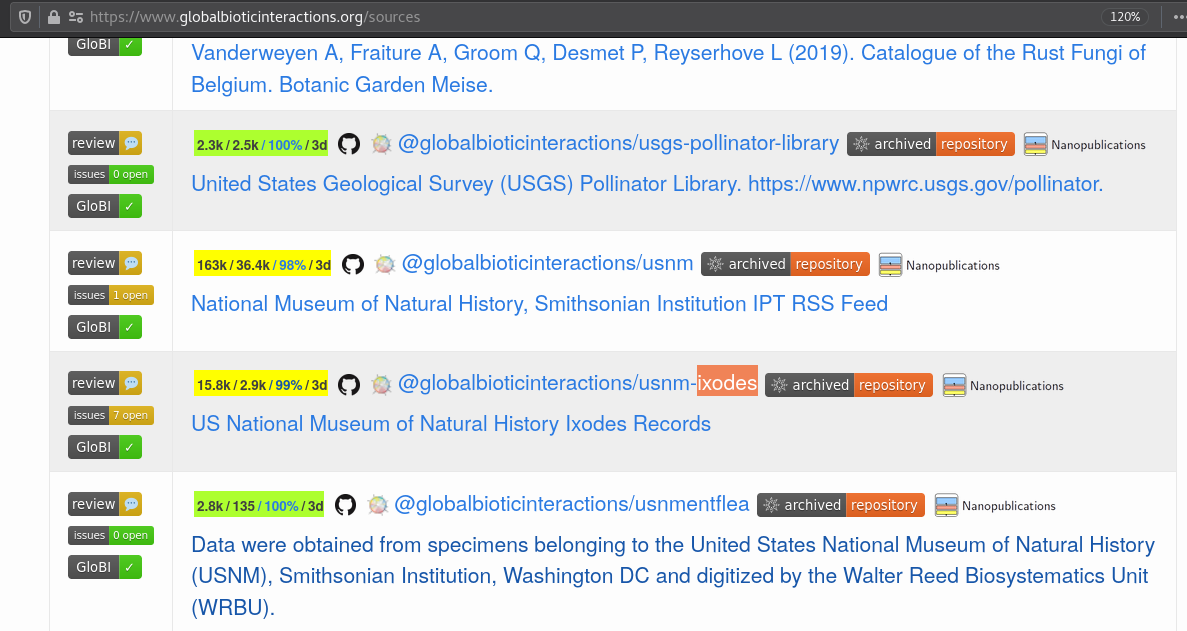
Exercise 1: Find Data SourcesVisit https://globalbioticinteractions.org/sources and locate:
the USNM Ixodes Collection,
Seltmann’s Tick Interaction Database, and
iNaturalist observation records.
For each data source, click on the
badge to explore some of their indexed interactions.
Describe one interaction for each data source in the collaborative notes.
GloBI builds the search index in the following steps:
- Find registered interaction data in Github and Zenodo.
- Access/download and version digital dataset
- Integrate interaction records using translation tables into a knowledge graph
- allow for Reuse by publishing integrated data products and services
These steps are repeated regularly, often many times a week, to include new additions or other updates.
Want to Learn More about Data Indexing Steps?Visit https://globalbioticinteractions.org/process and learn more about the GloBI indexing process and the tools.
Data Source Reviews
To help better understand how GloBI interprets data sources, automated data reviews are made available for each data source, or dataset.
These dataset specific reviews include:
- lists of review notes and summaries (e.g., review.tsv files),
- checklists of taxonomic names (e.g., indexed-names.tsv), and
- indexed interaction data records (e.g., indexed-interactions.tsv).
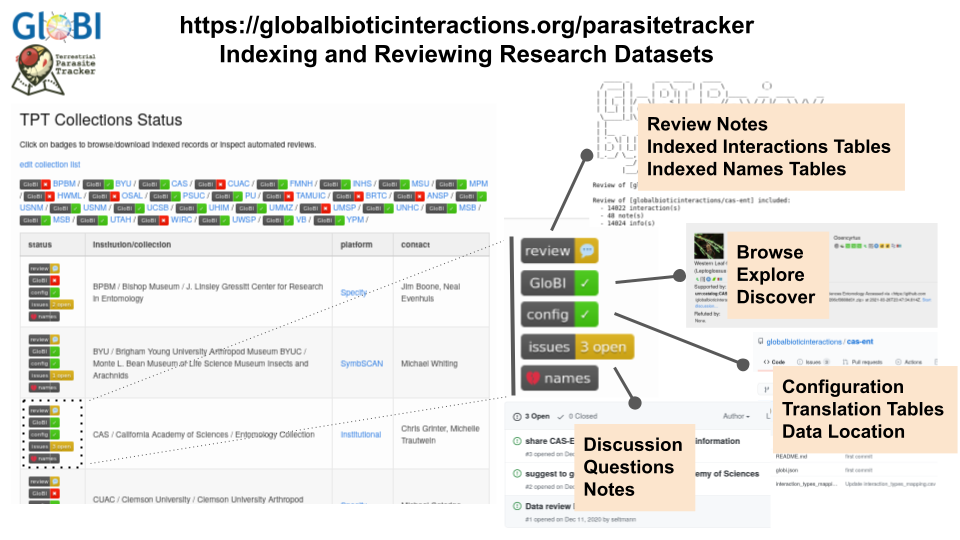
Exercise 2: Parasite Tracker Data Source: CASVisit the GloBI’s Parasite Tracker project page at https://globalbioticinteractions.org/parasitetracker and locate the California Academy of Sciences / Entomology Collection.
Click on each of the buttons and describe the function of the “review”, “GloBI”, “config”, “issues” and “names” badges.
Also, in the review log, note how many interactions GloBI found in the California Academy of Sciences Entomology collection.
In this lesson episode, you’ve learned that GloBI is a search index that helps to explore interaction data in existing data sources.
Also, you found the list of GloBI data sources and discovered the search-by-datasource, review and configuration links.
Key Points
GloBI is built using existing data sources
Data sources are continously and automatically indexed by GloBI
GloBI provides automated reviews of data sources
Taxonomic Name Review
Overview
Teaching: 10 min
Exercises: 10 minQuestions
How does GloBI interpret taxonomic names?
How can I find taxonomic names that GloBI didn’t understand?
Does GloBI use single taxonomic backbone?
Objectives
Understand how GloBI links provided names to existing taxonomic naming schemes
Know to where to go to find, and discuss, suspicious taxonomic names
Goal
The goal of this lesson is to understand how, and why, GloBI indexes and links taxonomic names.
Why Link Taxonomic Names?
Taxonomic names are used in literature and datasets to classify living organisms. To increase the discoverability of species interaction data, GloBI links and indexes provided taxonomic names to enable queries like: which mammals (Mammalia) are known the host ticks (ticks)? Also, taxonomic name linking enables retrieval of key images and common names to help provide a context and make it easier to interpret an interaction claim.
Taxonomic Name Linking Challenges
However, significant challenges exist to interpret and link taxonomic names, especially when dealing with datasets from different eras, authors, and disciplines.
These taxonomic name interpretation challenges include, but are not limited to:
- Use of common names instead of scientific names (e.g., “kip” (Dutch) or “chicken” (English) vs. “Gallus gallus domesticus”)
- Typos (e.g., “Gallvs gallus” instead of “Gallus gallus”)
- Ambiguous names (e.g., “Anura” is a genus of flowering plants in the daisy family of as well as an order for frogs).
- Outdates/ disputed names (e.g., taxonomic revisions re-interpret classifications and re-assign names)
- Incomplete hierarchies (e.g., data sources provide species name, but no higher order taxonomic ranks)
Taxonomic Name Links
GloBI uses existing taxonomic name parsing and resolving tools to help find reasonable links between provided (or verbatim) names from data sources and existing taxonomic name lists. Rather than using a single taxonomic backbone, a variety of name sources is used. These name sources include, but are not limited to: Integrated Taxonomic Information System (ITIS),
 World Register of Marine Species (WoRMS),
 NCBI Taxonomy,
Wikidata Taxonomy,
Encyclopedia of Life (EOL) species pages,
FishBase,
SeaLifeBase,
iNaturalist Taxonomy,
 GBIF Backbone Taxonomy, and
  Plazi’s TreatmentBank.
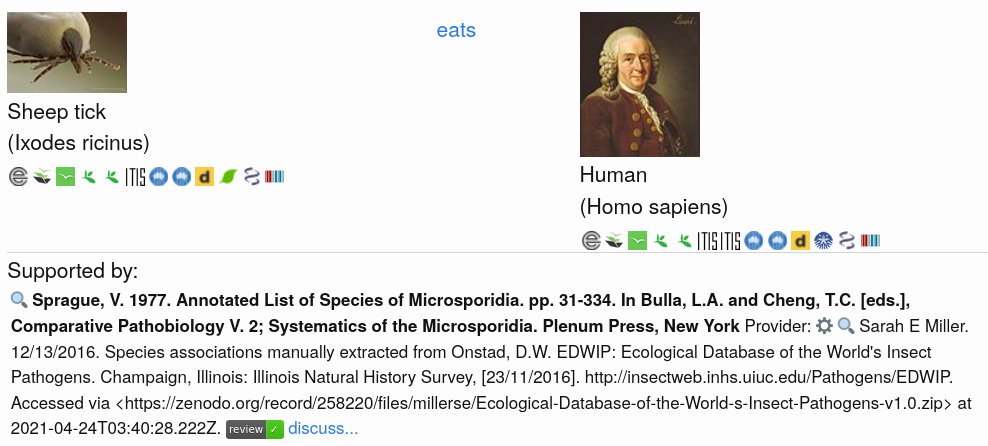
Exercise 1. Discover Taxonomic LinksNote the icons representing the various taxonomic name schemes in the screenshot of an interaction claim of a sheep tick (Ixodes ricinus) eating a human (Homo sapiens).
Click on the image to try and reproduce the results. Then, discover the taxonomic linkages using the icons below the image. Note what project provides the images for the taxa. Also, record some examples of the urls pointing to the taxonomic name resources by right-clicking on the icon and copy-pasting link using “copy link location” (or similar). What do you notice?
GloBI’s Taxonomic Name Linking Process
The process to index and resolve taxonomic names currently consists of two phases.
Phase 1. Create a Taxonomic Name Map (aka GloBI’s Taxon Graph)
a. extract taxonomic names/ids from data sources
b. pre-process and parse names/ids
c. match names/ids against existing names resolvers/name lists
d. version and publish (updated) taxon name map/graph
Phase 2. Create Search Index
a. load specific version of taxon name map/graph
b. on encountering mapped taxonomic names/id, add to extra information index
c. on countering unmapped name/id, tag name with “no:match”
d. version and publish interaction search index
Want to Learn More about GloBI's Taxonomic Name Matching?Visit https://globalbioticinteractions.org/process to learn more about taxonomic name matching. Also, you might want to have a look at a recent publication of GloBI’s Taxon Graph at https://doi.org/10.5281/zenodo.755513 .
Finding Suspicious or New Names
If GloBI encountered a name that has not yet been successfully mapped in GloBI’s Taxon Graph, the name is labeled with “no:match” in the search engine. Now, we can use this label to find interaction records that include names that are new to GloBI or failed to match to supported taxonomic name schemes.
So, “no:match” names might include names that contain typos, but may also include names that are valid, but have not yet been included in GloBI’s Taxon Graph.
Exercise 2. Finding Suspicious NamesShow three ways you can find suspicious names using GloBI tools.
Feedback Loops
Exercise 3. Reporting a suspicious name or starting a discussionAdd add examples on how to reach out to peers to discuss suspicious names or records.
Key Points
Taxonomic name linking facilitates discovery, review, and interpretation, of interaction records
GloBI uses a versioned taxonomic name map to map verbatim names into known taxonomic schemes
GloBI attempts to provide reasonable links using a controlled and iterative process
GloBI taxonomic name linking process is likely imperfect and subjective
Interaction Data Record Review
Overview
Teaching: 15 min
Exercises: 5 minQuestions
How can I understand how GloBI interpreted my dataset?
Can GloBI help me improve my dataset?
Objectives
Find out where GloBI reviews are located.
Find out how to explore GloBI reviews
Goals
The goal of this lesson is to introduce you to data reviews in GloBI.
Getting started
At the end of this time we will regroup and report back the other workshop participants about what we did in this breakout group. Who would like to be the person/s who report back for the breakout group?
Let’s collaboratively take notes in the Google Document. The link to the document is in the chat.
What is a review
A review in GloBI is an output that lets us know how GloBI interpreted or viewed the data being indexed. It is an opportunity to see if you agree with the interpretation or find issues in the data that can be corrected. It also provides some cool statistics about the number of interaction records indexed from a particular dataset. Reviews are done by dataset only. Reviews are useful for people who are submitting data, data curators, or anyone who wants to know more about a particular dataset.
Finding the reviews
Remember we explored in working with data sources that all GloBI data sources are listed on the sources page. In addition, providers for Terrestrial Parasite Tracker have their own webpage.
Let’s examine a GloBI data review. Visit https://globalbioticinteractions.org/sources and locate the ucsb-izc collection. Click on the
badge.
What is what? An overview of the data.
   _____ _       ____ _____   _____            _
  / ____| |     |  _ \_   _| |  __ \          (_)
 | |  __| | ___ | |_) || |   | |__) |_____   ___  _____      __
 | | |_ | |/ _ \|  _ < | |   |  _  // _ \ \ / / |/ _ \ \ /\ / /
 | |__| | | (_) | |_) || |_  | | \ \  __/\ V /| |  __/\ V  V /
  \_____|_|\___/|____/_____| |_|  \_\___| \_/ |_|\___| \_/\_/
 | |           |  ____| | |
 | |__  _   _  | |__  | | |_ ___  _ __
 | '_ \| | | | |  __| | | __/ _ \| '_ \
 | |_) | |_| | | |____| | || (_) | | | |
 |_.__/ \__, | |______|_|\__\___/|_| |_|
         __/ |
        |___/

Review of [globalbioticinteractions/ucsb-izc] started at [2021-04-26T06:04:32+02:00].

Review of [globalbioticinteractions/ucsb-izc] included:
  - 1440 interaction(s)
  - 25 note(s)
  - 1442 info(s)

[globalbioticinteractions/ucsb-izc] has 25 reviewer note(s):
      7 found unsupported interaction type with name: [Visiting]
      6 source taxon name missing: using institutionCode/collectionCode/collectionId/catalogNumber/occurrenceId as placeholder
      3 found unsupported interaction type with name: [Sitting on]
      3 found unsupported interaction type with name: [Hovering over]
      2 found unsupported interaction type with name: [Feeding on]
      1 found unsupported interaction type with name: [Visitng]
      1 found unsupported interaction type with name: [visiting]
      1 found unsupported interaction type with name: [Tended by]
      1 found unsupported interaction type with name: [Next to]
1440 interaction(s) is number of interactions indexed by GloBI from this dataset.
25 note(s) or rows in the dataset that are flagged and might be interesting to have a look at.
1442 info(s) or information about biotic interaction indexing process. These are not flagged records, but more like comments or data logging.
6 source taxon name missing where the taxon name field is blank or empty
unsupported interaction type indicates that no mapping is defined by the data source. Terms are defined by linking to the Relations Ontology.
What is what? I want more information.
GloBI data reviews are packaged in downloadable text files (tab and comma delimited). The review-sample files are small enough to quickly view.
This review generated the following resources:
  - review.svg (review badge) https://depot.globalbioticinteractions.org/reviews/globalbioticinteractions/ucsb-izc/review.svg
  - review.tsv.gz (data review) https://depot.globalbioticinteractions.org/reviews/globalbioticinteractions/ucsb-izc/review.tsv.gz
  - review-sample.tsv (data review sample tab-separated) https://depot.globalbioticinteractions.org/reviews/globalbioticinteractions/ucsb-izc/review-sample.tsv
  - review-sample.json (data review sample json) https://depot.globalbioticinteractions.org/reviews/globalbioticinteractions/ucsb-izc/review-sample.json
  - review-sample.csv (data review sample csv) https://depot.globalbioticinteractions.org/reviews/globalbioticinteractions/ucsb-izc/review-sample.csv
  - indexed-interactions.tsv.gz (indexed interactions) https://depot.globalbioticinteractions.org/reviews/globalbioticinteractions/ucsb-izc/indexed-interactions.tsv.gz
  - indexed-interactions.csv.gz (indexed interactions) https://depot.globalbioticinteractions.org/reviews/globalbioticinteractions/ucsb-izc/indexed-interactions.csv.gz
  - indexed-interactions-sample.tsv (indexed interactions sample) https://depot.globalbioticinteractions.org/reviews/globalbioticinteractions/ucsb-izc/indexed-interactions-sample.tsv
  - indexed-interactions-sample.csv (indexed interactions sample) https://depot.globalbioticinteractions.org/reviews/globalbioticinteractions/ucsb-izc/indexed-interactions-sample.csv
  - indexed-names.tsv.gz (indexed names) https://depot.globalbioticinteractions.org/reviews/globalbioticinteractions/ucsb-izc/indexed-names.tsv.gz
  - indexed-names.csv.gz (indexed names) https://depot.globalbioticinteractions.org/reviews/globalbioticinteractions/ucsb-izc/indexed-names.csv.gz
  - indexed-names-sample.tsv (indexed names sample) https://depot.globalbioticinteractions.org/reviews/globalbioticinteractions/ucsb-izc/indexed-names-sample.tsv
  - indexed-names-sample.csv (indexed names sample) https://depot.globalbioticinteractions.org/reviews/globalbioticinteractions/ucsb-izc/indexed-names-sample.csv
  - indexed-citations.tsv.gz (indexed citations) https://depot.globalbioticinteractions.org/reviews/globalbioticinteractions/ucsb-izc/indexed-citations.tsv.gz
  - indexed-citations.csv.gz (indexed citations) https://depot.globalbioticinteractions.org/reviews/globalbioticinteractions/ucsb-izc/indexed-citations.csv.gz
  - nanopub.ttl.gz (interactions nanopubs) https://depot.globalbioticinteractions.org/reviews/globalbioticinteractions/ucsb-izc/nanopub.ttl.gz
  - nanopub-sample.ttl (interactions nanopub sample) https://depot.globalbioticinteractions.org/reviews/globalbioticinteractions/ucsb-izc/nanopub-sample.ttl
  - review.zip (review archive) https://depot.globalbioticinteractions.org/reviews/globalbioticinteractions/ucsb-izc/review.zip
Get a glimpse of the review in Google Sheets
1 - Import a review-sample file into Google Sheets
2 - Download the full review archive 3 - Import the indexed-interactions-sample.tsv into Google Sheets
Exercise 1: Find Data SourcesVisit https://globalbioticinteractions.org/sources and locate the USNM Ixodes Collection, Seltmann’s > Tick Interaction Database, or iNaturalist observation records. For each, click on the
Key Points
There are many ways to access GloBI reviews.
GloBI reviews can help data managers better understand their data and how GloBI interprets it.
Day Two Pre-workshop Assignment
Overview
Teaching: 0 min
Exercises: 30 minQuestions
What is an ecological network?
Why/How do researchers visualize pairwise interactions and the ecological networks they originate from?
Why/How do researchers quantify pairwise interactions and the networks they originate from?
Objectives
Explore ways to visualize ecological networks
Explore ways to quantify or analyze ecological network
Provide one example of an existing publication that includes interaction data
Articulate benefits of openly sharing research data
Getting Started
Welcome to the description of the pre-workshop assignments for the second day of the Dead Wood 2021 Interaction Data workshop!
You can find the main workshop page here.
In the second day of the Dead Wood 2021 Interaction Data workshop, we’ll be focusing on exploring ways to understand, analyze, visualize, and quantify, ecological networks.
If you haven’t yet introduced yourself in the first pre-workshop assignment, please review/complete part 1. in our second pre-workshop assignment document at https://docs.google.com/document/d/1WaA6xiU6RCpNo6IhHmwSJvHVMQCEycjP-FUngo_MCKE/#. If you’d like to re-use your existing introduction, please copy-paste your existing introduction from the pre-work assignment day 1.
Assignment 1: Introduce Yourself
- Go to https://docs.google.com/document/d/1WaA6xiU6RCpNo6IhHmwSJvHVMQCEycjP-FUngo_MCKE/edit
- Add your name,
- Add your field of work/study/research, and
- Describe a species interaction you enjoy or find interesting.
If you’ve already introduced yourself in the first pre-workshop assignment, feel free to reuse that by copy-pasting it.
If you’d like, you can copy and paste the following example:
Hi, my name is [name]. The pronouns I use are [pronouns]. I am interested in [field of study/research/work]. In this workshop, I’d like to [goals]. One of my favorite biotic interaction is that of a [describe a species interaction].
To help you get started, I filled out mine:
Hi, my name is Jorrit. The pronouns I use are he, him, his. I am interested in biodiversity informatics, open science, and software engineering. In this workshop, I’d like to better understand how to make it easier for students/researchers to share and reuse species interaction data. One of my favorite interactions is of this bird (Sula leucogaster) riding on the back of a sea turtle (Chelonia mydas). See https://www.inaturalist.org/observations/10161815 .
Now, to warm up and prepare for Dr. Talya Hackett’s “Introduction to Network Ecology” and the group assignments that follow, please sharing an example of a definition of what a ecological network is. Also, please provide some published examples of visualizations and quantifications (e.g., network statistics, metrics) you find useful and challenging.
If you need inspiration, you might want to review the literature that Dr. Talya Hackett suggested below.
What is an Ecological Network?
Many definitions of ecological networks exist and are used.
`Assignment 2: Definition of Ecological Network
describe, in your own words, what an ecological network is.
(extra credit) find a cited quote of such definition in published work
please prefix your contributions with your name in parenthesis
Published Ecological Network Visualizations
Species interactions drive the ecological engines that keep us alive. Bluntly said: without pollinators, crops would fail, without predators, populations would grow unchecked. Also recent events suggest that better understanding specific species interactions (e.g., virus-host interactions like bat zoonoses) may help us better predict, manage, or even prevent future pandemics.
Assignment 3a: Published Network Visualizations I Find Useful
Look for a published figure or diagram that contains a visualization of a network that you find useful.
Include a screenshot/image of the visualization in https://docs.google.com/document/d/1WaA6xiU6RCpNo6IhHmwSJvHVMQCEycjP-FUngo_MCKE/edit#heading=h.56n9eiwqsrm1
Provide a short description of why you find the visualization useful.
Include a citation to the publication in which you found the figure/ diagram
Make sure that your figure is not yet included by someone else.
Some visualization are more useful then others, especially when working with complex data like ecological networks.
In the following example, please try and find an example of a published network visualization that you find challenging to interpret and understand. Note that visualization can be beautiful and not so useful at the same time.
Assignment 3b: Published Network Visualizations I Find Challenging
Look for a published figure or diagram that contains a visualization of a network that you find challenging.
Include a screenshot/image of the visualization in https://docs.google.com/document/d/1WaA6xiU6RCpNo6IhHmwSJvHVMQCEycjP-FUngo_MCKE/edit#heading=h.stvhgw7shsa
Provide a short description of why you find the visualization less useful that your previous example.
Include a citation to the publication in which you found the figure/ diagram
Make sure that your figure is not yet included by someone else.
Quantifying (Ecological) Networks
Useful visualizations can help understand complex (ecological) network data. And, quantifying networks using network statistics or other metrics might also help get a grasp on characteristics of a network graph (e.g., nodes connected via edges).
As with visualizations, some quantitative methods are more helpful than others.
Assignment 4a: Published Network Metrics I Find Useful
Look for a published example numeric method or metric that characterizes a network that you find useful.
Include a screenshot/quote of your example in https://docs.google.com/document/d/1WaA6xiU6RCpNo6IhHmwSJvHVMQCEycjP-FUngo_MCKE/edit#heading=h.pxidae6seywp
Provide a short description of why you find the method useful.
Include a citation to the publication in which you found the example
Make sure that your example/method is not yet included by someone else.
Also, add an example of a metric or numeric method that you find not so useful, challenging, or potentially misleading.
Assignment 4b: Published Network Metrics I Find Challenging
Look for a published example numeric method or metric that characterizes a network that you find less useful than your previous examples.
Include a screenshot/quote of your example in https://docs.google.com/document/d/1WaA6xiU6RCpNo6IhHmwSJvHVMQCEycjP-FUngo_MCKE/edit#heading=h.pxidae6seywp
Provide a short description of why you find the method challenging or misleading.
Include a citation to the publication in which you found the example
Make sure that your example/method is not yet included by someone else.
Thanks for taking the time to work through these pre-workshop assignments for day two .
Suggested Reading
Please also consider reading the following references suggested by Dr. Talya Hackett.
Suggested ReadingProulx, S., Promislow, D. & Phillips, P., 2005. Network thinking in ecology and evolution. Trends in Ecology & Evolution, 20(6), pp.345–353. Available at: https://doi.org/10.1016/j.tree.2005.04.004
- “[…] a great intro into networks and their applications […]”
Memmott, J., 1999. The structure of a plant‐pollinator food web. Ecology Letters, 2(5), pp.276–280. Available at: https://doi.org/10.1046/j.1461-0248.1999.00087.x
- “[…] the classic start of quantitative plant-pollinator networks so worth knowing for the history of the field […]”
Blüthgen, Nico, Menzel, F. & Blüthgen, Nils, 2006. BMC Ecology, 6(1), p.9. Available at: https://doi.org/10.1186/1472-6785-6-9.
- “[…] a nice overview of a range of metrics and what they can be used for regarding specialisation and traits (and brings up the important issue of using weighted/quantitative networks)[…]”
If you have troubles accessing the articles, please contact the workshop organizers.
What’s Next?
If you are interested to learn more about what is next, please review the workshop schedule for day 2 of your Dead Wood 2021 workshop.
Key Points
Ecological network data can be multi-faceted and complex
Many existing methods exist to visualize and quantify ecological networks
Day Two Group Assignment Part Two
Overview
Teaching: 20 min
Exercises: 55 minQuestions
What are the likely side-effects in a data analysis pipeline?
How can I create a bipartite visualizations in R?
What does it take to calculate ecological networks metrics?
Objectives
Articulate benefits / downsides of data pre-processing
Discover limitations of traditional analysis and visualizations
In this session, we’ll go through the steps from acquiring data, to “cleaning” data, to visualizing and analyzing the results.
First, we’ll have a look at likely side-effects of preparing data for analysis and visualization.
Side-effects of Pre-processing Data
Data may be reformatted and “cleaned” to help facilitate analysis, visualization, and re-use.
In this exercise, we’ll look at a specific dataset and it’s transformations in the GloBI processing pipeline.
This example pipeline likely reflects other research data processing (automated or manual) techniques in use today.
Exercise 1. Data Processing Side-effects
Re-visit the GloBI process page at https://globalbioticinteractions.org/process .
Locate the original dataset related to Olito, Colin; Fox, Jeremy W. (2015), Data from: Species traits and abundances predict metrics of plant–pollinator network structure, but not pairwise interactions, Dryad, Dataset, https://doi.org/10.5061/dryad.7st32 .
Now, locate the manually transcribed version
interactions.tsvof this dataset at https://github.com/zedomel/olito2015.Inspect a version of the same dataset as seen by GloBI before taxonomic linking at https://depot.globalbioticinteractions.org/reviews/zedomel/olito2015/indexed-interactions.csv
Inspect dataset version after GloBI’s taxonomic linking at olito2015.csv
Compare the different versioned of the dataset and describe the similarities and changes. Note where in the process diagram the datasets live.
Now, let us have a look at visualizing and analyzing network data.
Visualization: Bipartite and Pre-canned Data
Exercise 2. Looking at Pre-canned Data
Locate a populate R package by doing a web search for “bipartite R package”
In the R package page, notice the “starting with bipartite” vignette.
If feasible, install package in your R environment
Reproduce the bipartite visualization vignette example with the
olito2015network .
Notice how much time it take to setup an environment and reproduce a “getting started” example.
Visualization: Bipartite and “Real” Data
Some biodiversity data infrastructures (like GloBI, GBIF) hide the complexities of working with big datasets by offering Web-accessible API (Application Programming Interfaces). Instead of getting all the data on your system, you ask for a specific subset of the data, and let some remote server do the heavy lifting. In this exercise, we’ll use an API that GloBI provides through the rglobi package.
Exercise 3. Plot a bipartite visualization with "real" data
use the
rglobi::get_interactions_by_taxamethod to retrieve records describing Fungi interacting with Oak trees (Quercus). Alternatively, use the GloBI Browser to do a similar web query.save the results in a csv file
count the number of records in the csv file
use this csv file to re-create the bipartite visualization of the second exercise
Feel free to use the cheatsheet.
Analyzing Lots of Data
To prepare for this workshop, you downloaded one of GloBI’s data products, the interactions.csv.gz from the https://globalbioticinteractions.org/data page.
Exercise 4. Counting all the things
count the number of records in
interactions.csv.gz(extra credit) count the number of records that contain “Fungi” in them
(extra credit) count the number of record that contain both “Fungi” and “Quercus” in them
Please feel free to use any tool you’d like. Also, please see the Big Data Cheatsheet.
Also, for your convenience, please see files oakfungi-sample.csv and oakfungi.csv for examples of results.
Exercise 5. Visualizing all the things
create a bipartite graph for oakfungi-sample.csv
now, create a bipartite graph for oakfungi.csv
compare the visualization and notice the differences
The bipartite r package contains various methods to quantitatively describe networks.
Exercise 6. Exploring Network metrics
re-visit the bipartite vignette pdf
in the vignette, look for the network, group, link, and species metrics (or indices)
(extra credit) calculate some indices using oakfungi-sample.csv or oakfungi.csv datasets.
Now that we’ve tried a couple of ways to access, visualize, and analyze data, let’s reflect on how these methods fit into a research workflow.
Discussion
What are the benefits to using a whole dataset like GloBI’s
interactions.csv.gz?What are the benefits of using the GloBI Web API instead?
What method would you choose for your publication?
How would you cite / publish your results?
How would you assess the quality of the retrieved data?
What’s Next?
Please see schedule to see what’s next.
Key Points
Working with big datasets often requires different tools and skills
Data processing introduces errors and bias
Many tools are suited for small datasets only