Ever Been Eaten by Flies in Puerto Rico? You're Not Alone . . .
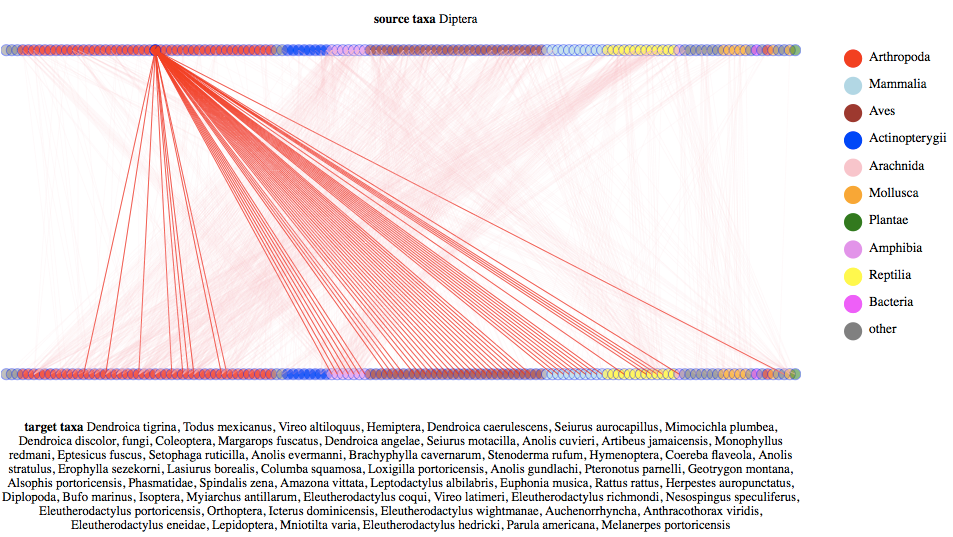
The graph above shows GloBI species interaction data in action, and answers a question you might ask yourself when the flies start nipping on your holiday in Puerto Rico.
The graph shows the interaction between source (top circles) and target (bottom circles) taxa or species. The lines between the taxa represent an observed interaction between the source (e.g., predator) and target (e.g., prey) organisms. In the graph, the top source taxon for true flies (Diptera) is selected, and, as you can see, they feast on all sorts of organisms, including us poor mammals (represented by the bottom light blue circles). The source and target circles are ordered in the same way and grouped according to their location in the tree of life or taxonomy. The colors of the circles represent the higher-order taxonomic rank (e.g., kingdom, phylum) of the taxon. Some people might call this interaction graph a bipartite graph, where others might see it as a simple form of a hive plot.
So by now, you should be able to answer the question you might ask when you visit Puerto Rico: "Am I the only one who's getting eaten by flies?" This example shows how EOL's GloBI enables easy access to detailed information about species interactions and helps answer very specific ecological questions.
If you are interested in accessing the data available through GloBI, please visit the GloBI data wiki. Also, if you'd like to build your own species-interaction visualization, check out the GloBI JavaScript visualization library. This npm-packaged library was used to generate the picture above. With your help and comments, we can improve the quality of GloBI data and its supporting libraries, so please do share your feedback.
Credits: Thanks to the friendly, inspiring folks at the Sudo Room's East Bay Javascript Meetup for providing input on the REST services and JavaScript visualization library. Special shout-outs to substack, Max Ogden, and Bemson. Also, thanks to Ken-ichi Ueda of iNaturalist for sharing feedback on the interaction visualization.


